Industry: Beverage (Non-Alcoholic) / Fruit Juice
Role: Data Analyst
Business Problem
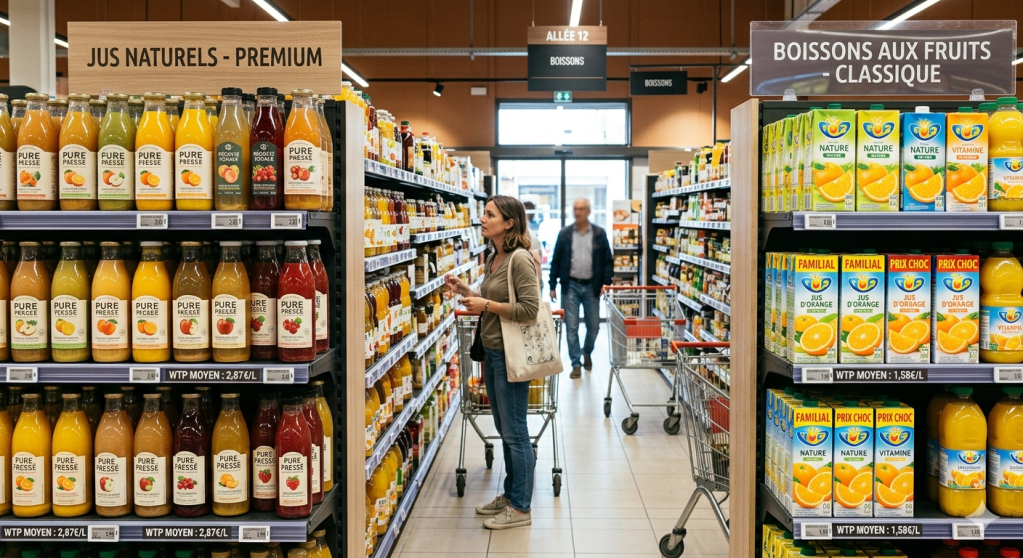
The fruit juice market is a dynamic sector within the Fast-Moving Consumer Goods (FMCG) industry, where the packaging impact is just as important as taste.
Brands often find it challenging to identify which attributes influence consumer purchases or justify premium prices. Data-driven insights are crucial for marketing teams to avoid investing in ineffective packaging elements.
Objectives
- Identify key drivers of purchase intention across sensory perception, packaging aesthetics, and brand trust.
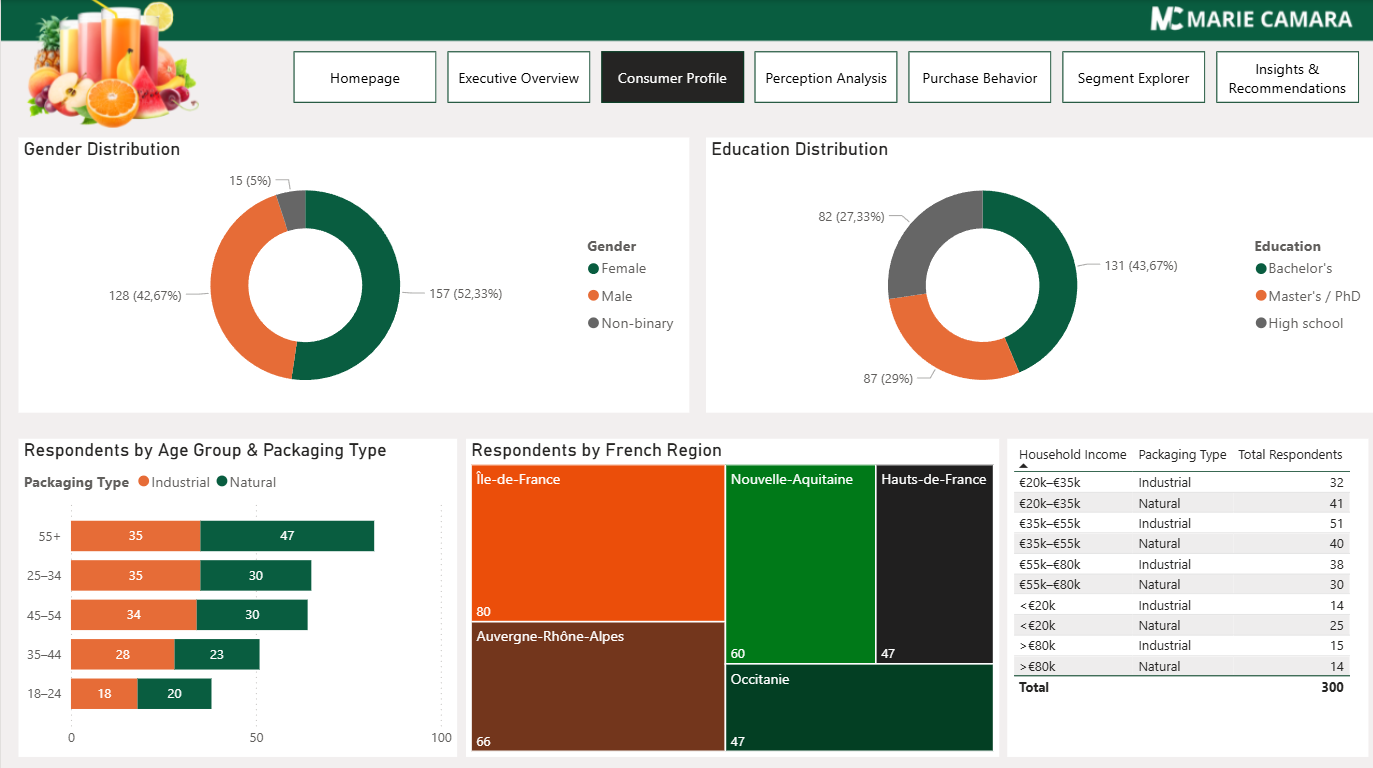
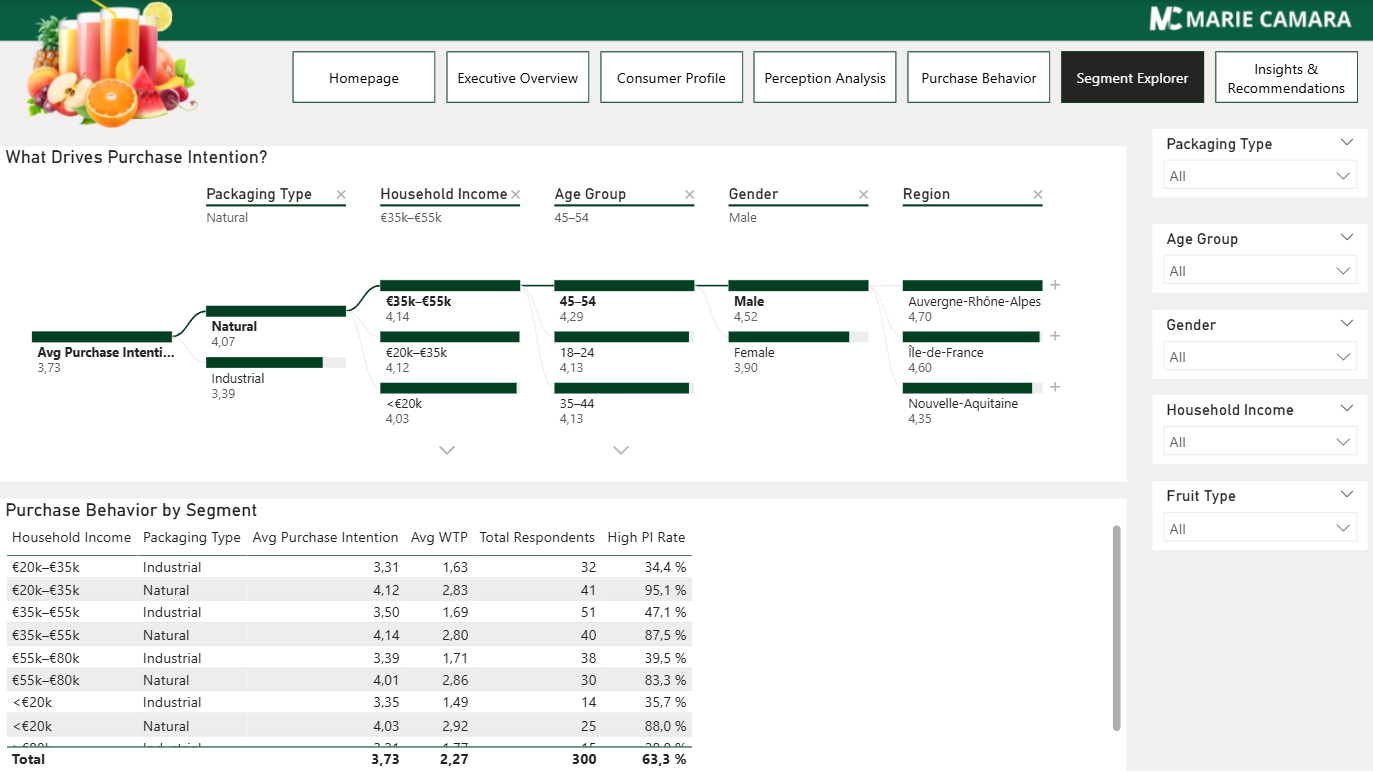
- Analyze consumer behavior across demographics (Age, Gender, Income) and retail channels (Supermarkets, Organic stores, Online).
- Evaluate the impact of packaging type (Natural vs. Industrial) and format (Glass, PET, Carton) on Willingness to Pay (WTP).
- Provide actionable recommendations to optimize packaging design and pricing strategies for different fruit juice categories.
Methodology and Tools Used
A structured end-to-end analytics pipeline was implemented, from data preparation to insight delivery through an interactive dashboard.
- Data Collection: Real-world consumer research dataset — 300 respondents, 25 variables covering demographics, juice consumption habits, packaging perception scores (1–7 Likert), and financial outcomes.
- Data Cleaning: Processed in Power BI to verify data types, handle categorical consistency (e.g., Region, Education), and validate numerical ranges for perception scores and Willingness To Pay (WTP).
- Data Transformation: Created calculated measures and columns in Power BI, including Age Group segmentation, Purchase Intention tiers, and WTP variances.
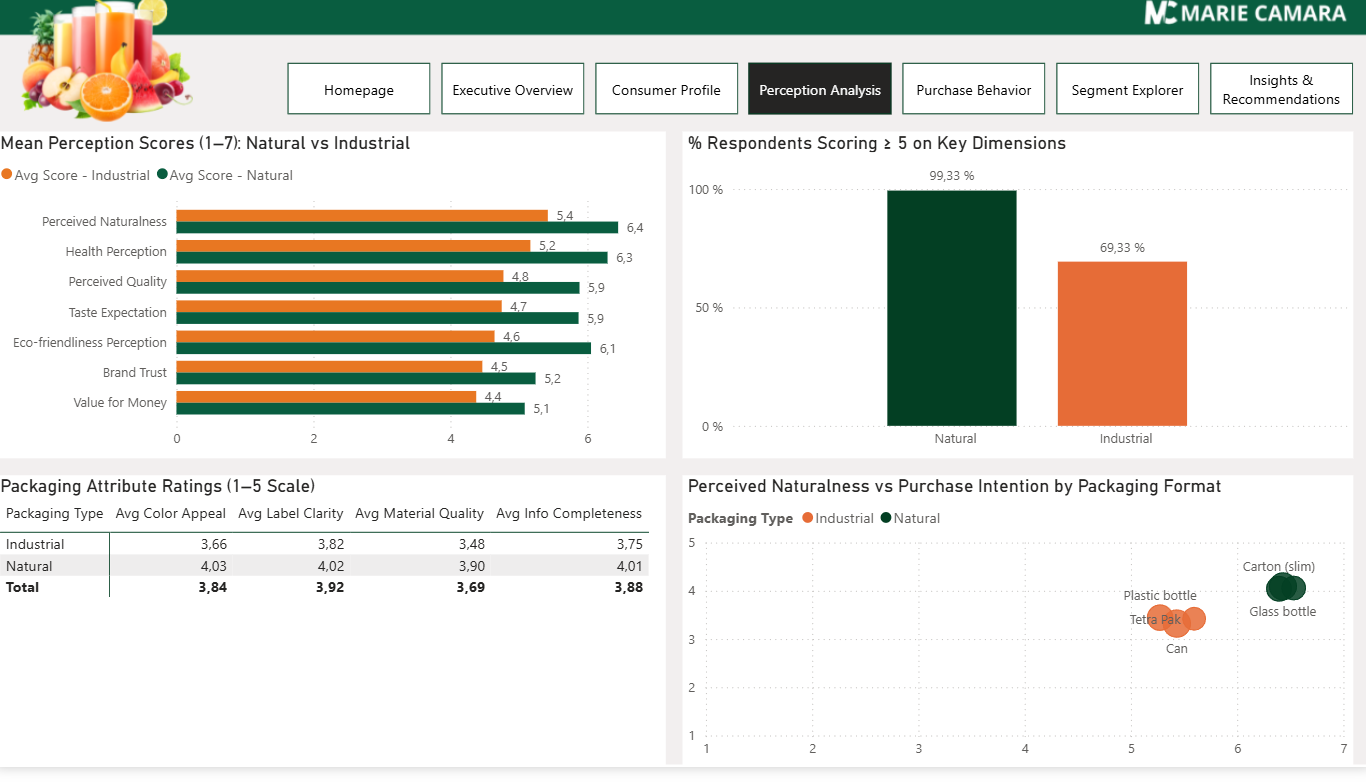
- Data Analysis: Conducted statistical analysis, including Mean Comparison (Natural vs. Industrial), Correlation Analysis to find links between variables.
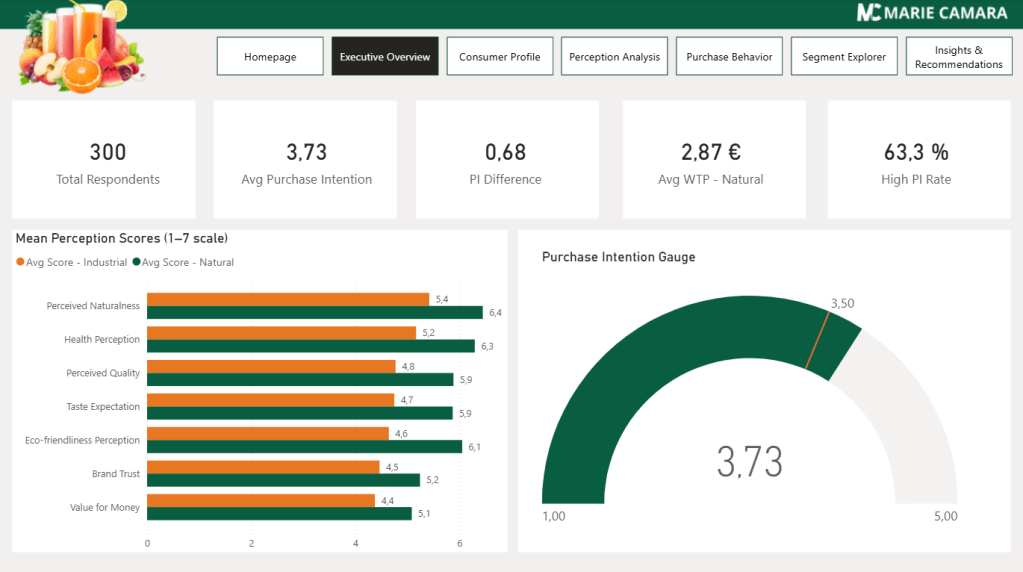
- Data Visualization: Designed a 6-page interactive Power BI dashboard (Executive Overview, Consumer Profile, Perception analysis, Purchase Behavior, Segment Explorer, Insights & Recommendations) with KPI cards, heatmaps, scatter plots, and advanced filtering
- Tools Used: Microsoft Excel, Power BI, Canva.
Key Deliverables
- Fully interactive Power BI dashboard with 6 analytical pages
- KPI Framework focused on Purchase Intention, Perceived Quality, and Price Elasticity.
- Segmentation analysis across demographics, packaging types, and retail channels
- Insights and strategic recommendations for decision-makers.

Key Insights
- Packaging Type Supremacy: “Natural” packaging (Glass, Transparent PET) outperforms “Industrial” formats (Tetra Pak, Cans), with a +1.12 point increase in Health Perception and +1.11 in Perceived Quality.
- Primary Drivers: Health Perception ($\beta = 0.187$) and Perceived Quality ($\beta = 0.158$) are the top predictors of Purchase Intention, surpassing eco-friendliness and color appeal.
- Price Premium: Consumers’ average willingness to pay is €2.87/L for Natural packaging, versus €1.58/L for Industrial packaging.
- Format Performance: Glass bottles have the highest Purchase Intention (4.09) and WTP (€2.94/L), indicating a strong preference for premium, sustainable materials.
- Channel Sensitivity: Organic store shoppers are most influenced by “Naturalness,” while Supermarket shoppers prioritize “Value for Money.”
Recommendations
- Prioritize Health Messaging: Design packaging with clear health cues (ingredient transparency, nutrient density) to increase conversion.
- Adopt Premium Materials: Use Glass or Transparent PET for premium juice lines to leverage the ~80% WTP premium over standard cartons.
- Segmented Pricing Strategy: Apply “Industrial” packaging (Cartons/Tetra Paks) for family segments with lower WTP, and “Natural” formats for individual health seekers.
- Improve Brand Trust: Enhance “Label Clarity” and “Information Completeness” to build trust, especially for new brands.
- Target Organic Channels: Launch “Natural” packaging initiatives in Organic and Specialty stores first, where consumer alignment with premium attributes is highest.
