Explore a collection of my business intelligence projects across diverse industries where I transformed data into actionable insights.
Each project outlines the business challenge, objectives, methodology, tools, insights, and recommendations.
These projects showcase how I built interactive dashboards and delivered data-driven recommendations to make smarter, faster decisions.
Financial Performance Analysis | Optimizing Revenue, Margins, and Business Performance
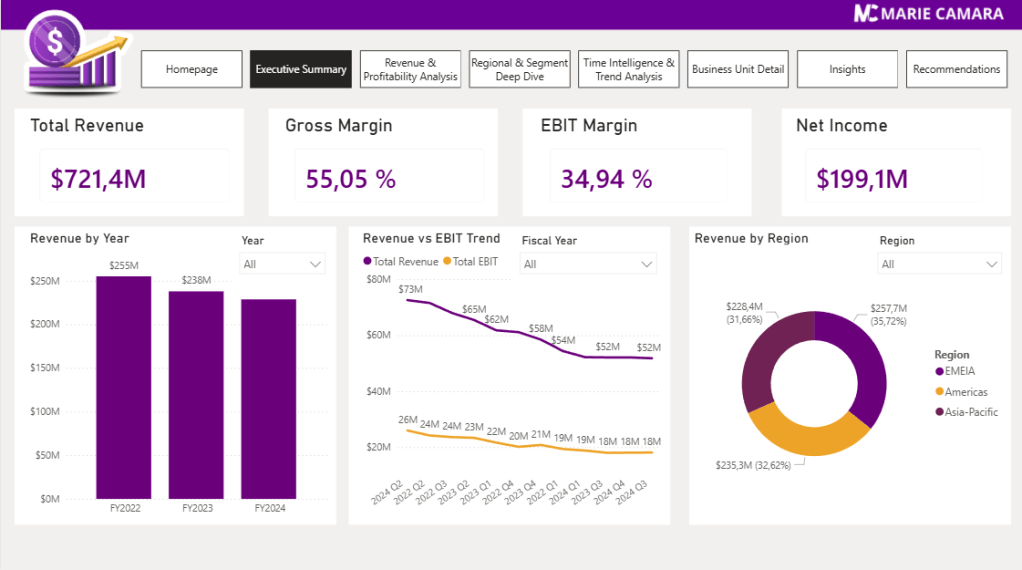
I analyzed synthetic financial transaction data spanning FY2022–FY2024 using Power BI to address margin compression, fragmented reporting, and revenue concentration risk across 3 regions, 4 business units, and 7 product lines.
Reducing No-Shows in Healthcare Platforms
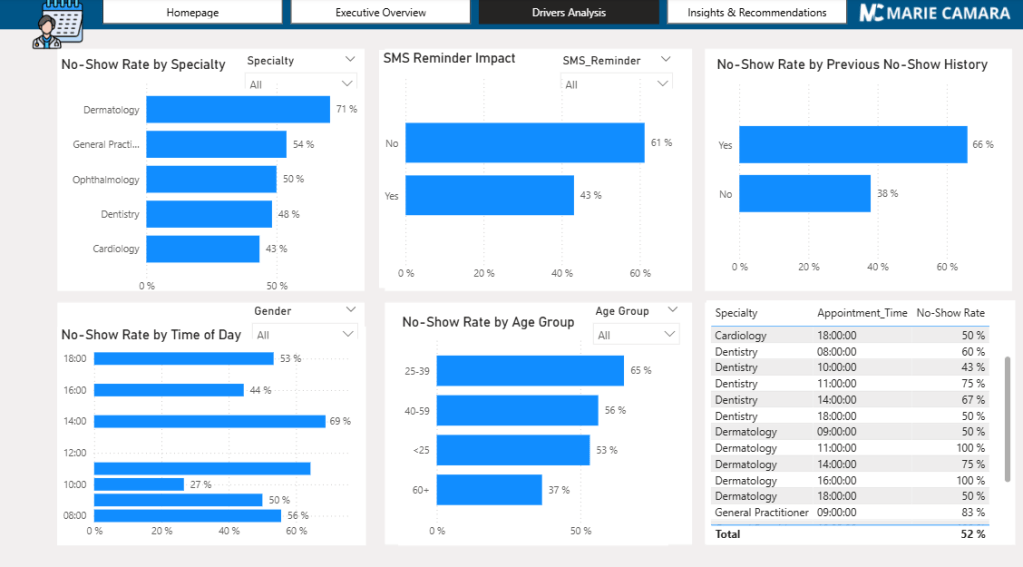
I analyzed appointment data to identify drivers of no-show appointments, assess the financial impact, and provide recommendations to reduce no-show rates.
Analyzing cosmetics consumer behavior
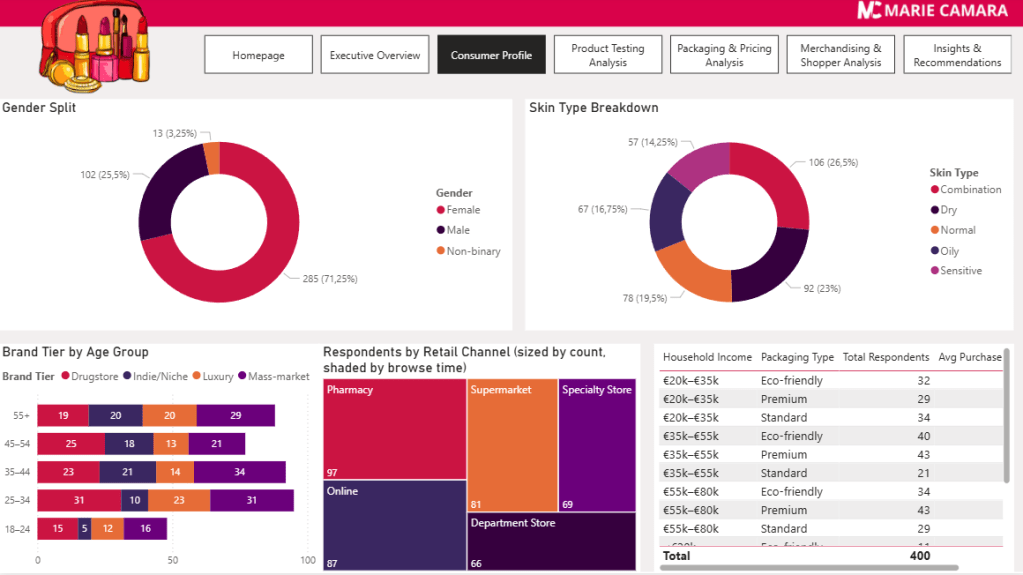
I analyzed consumer behavior in cosmetics to identify factors influencing purchase decisions, brand perception, and price sensitivity, providing insights for strategic product development and retail execution.
Analyzing Consumer Perception and Purchase Intention about Fruit Juice Packaging
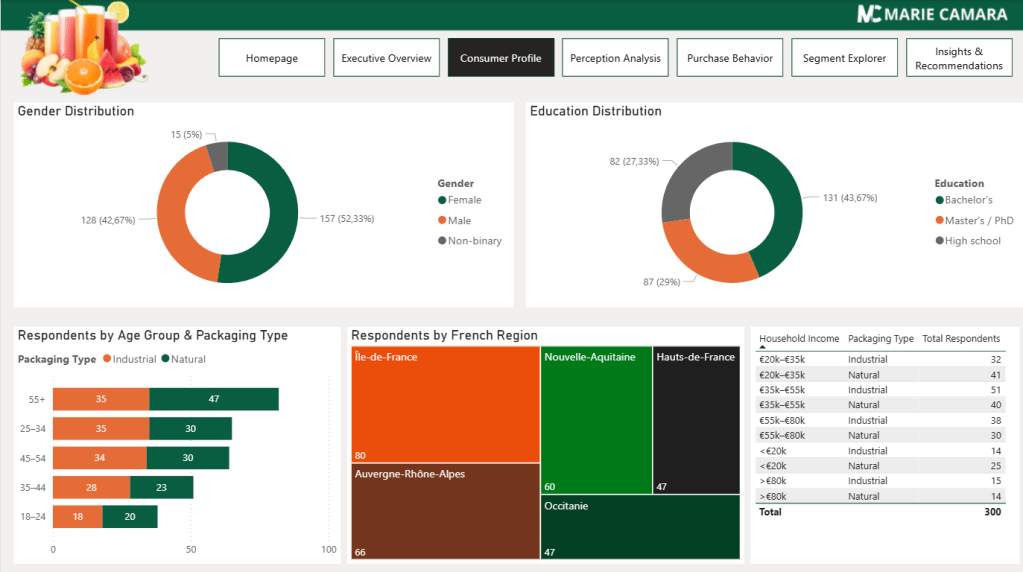
I analyzed consumer perceptions and purchase intentions in the fruit juice beverage sector to identify factors affecting packaging choice, brand loyalty and price sensitivity.
Optimizing User Engagement Through Behavior Analytics

The primary goal of this project was to leverage user behavior analytics to enhance engagement and improve the overall digital experience.
Strategies to Combat Shopping Cart Abandonment & Boost Sales

The primary goal of this project was to analyze customer behavior and improve the e-commerce checkout process.
Analyzing Customer Churn for a telecom company
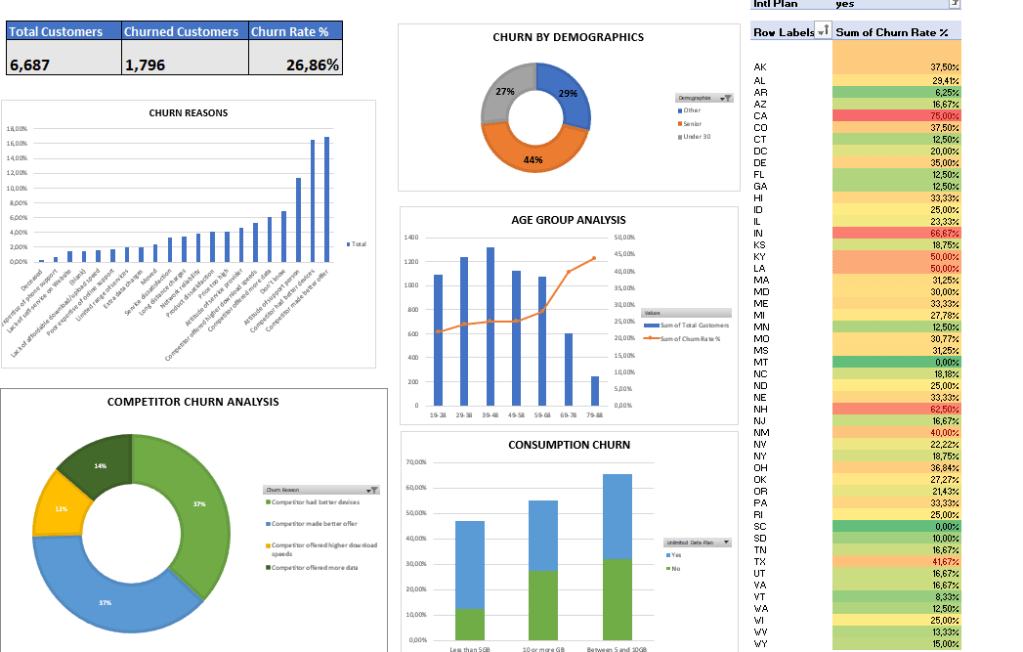
The primary goal of this project was to analyze customer behavior and improve customer retention.
Analyzing traffic patterns for a department of transportation
The project’s main objective was to analyze traffic patterns using three distinct charts: monthly volumes, weather, and holiday travel, utilizing Tableau.
Visualizing World Happiness by Factors
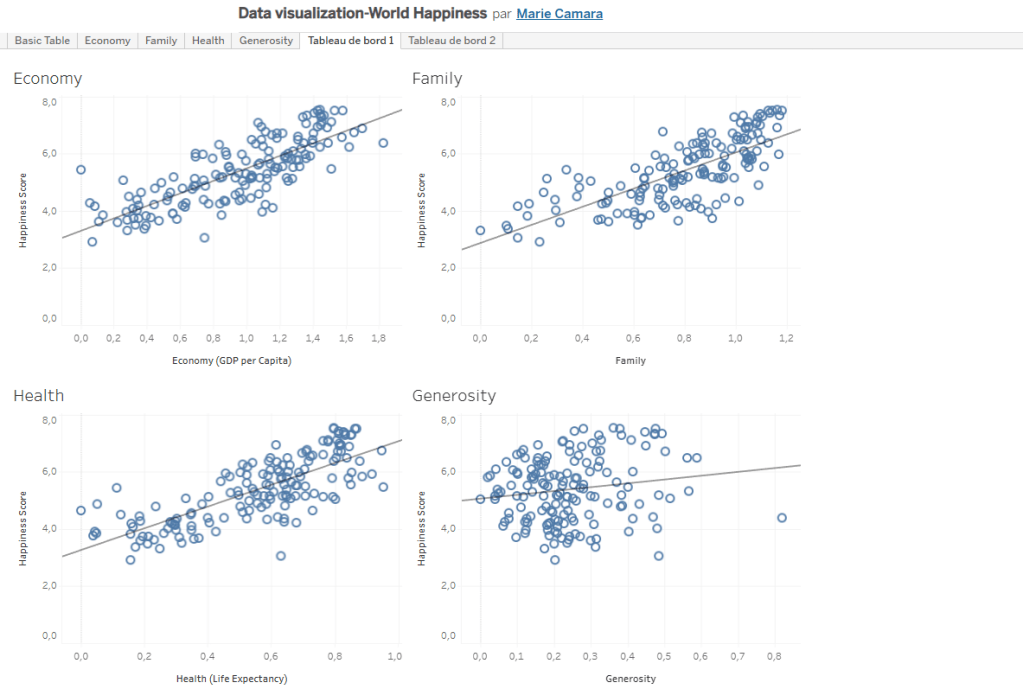
The main objective of this project was to visualize global happiness by factors such as economy, health, family, and generosity using Tableau.
